ANALYZE TABLE is replicated. RTFM.
Sometimes, I make mistakes. It’s true. That can be difficult for us Systems Engineering-types to say, but I try to distance myself from my ego and embrace the mistakes because I often learn the most from them. ..Blah, blah, school of hard knocks, blah, blah…. Usually my mistakes aren’t big enough to cause any visible impact, but this one took the site out for 10 minutes during a period of peak traffic due to a confluence of events.
Doh!
Here is how it went down…
We have an issue where MySQL table statistics are occasionally getting out of whack, usually after a batch operation. This causes bad explain plans, which in turn cause impossibly slow queries. An ANALYZE TABLE (or even SHOW CREATE INDEX) resolves the issue immediately, but I prefer not get woken up at 4AM by long running query alerts when my family and I are trying to sleep. As a way to work around the issue, we decided to disable InnoDB automatic statistic calculations by setting innodb_stats_auto_update=0. Then, we would run ANALYZE TABLE daily (via cron) during a low traffic period to force MySQL to update table statistics. This creates more stable and predictable query execution plans and reduces the number of places where we have to add explicit USE/FORCE/IGNORE INDEX clauses in the code to work around the query optimizer.
To accomplish this, I wrote a very simple shell script that runs ANALYZE TABLE against all InnoDB tables. After testing it in a non-production environment, it was pushed out to our passive (unused) master database with puppet. Because it was going to execute in the middle of the night for the first time, I decided to run it by hand once on our passive master database just to make sure everything was kosher. Call me a wimp, but I don’t like getting up in the middle of the night because my script took the site down (see comment about family and sleeping). We run our master/master databases in active/passive mode, so testing this on the passive server was a safe move.
Theoretically.
A little background on ANALYZE TABLE on InnoDB tables: All it really does is force a recalculation of table statistics and flush the table. A read lock is held for the duration of the statement, so you want to avoid running this on a customer-facing server that is taking traffic. Because the table is flushed, the next thread that needs to access the table will have to open it again. On our servers with FusionIO cards, it takes about 5 seconds to run ANALYZE TABLE on over 250 tables. All this was fine in Myopia City, because I was running this on the passive server.
Meanwhile, in another zip code, someone was testing out a SELECT against a production data set…
While I was testing my ANALYZE TABLE script, I receive an ominous, “yt?” message in Skype.
(Sidebar: In the history of Operations, has an engineer ever received a “yt?” message that lead to something awesome? Like, “yt? We’re going to send you a batch of fresh baked cookies every day for the next month.” That never happens.)
So, now I’m in a call. SITE DOWN! OMFGWTFBYOB!!! (No, it wasn’t like that. Really, we’re pretty cool-headed about stuff like this). This outage appeared to be database related. I logged in and checked the process list to see what was running:
(queries modified to protect the guilty)
That’s…strange. The RUN_LONG_TIME query seems to be blocking all the other queries on that table. But it’s just a SELECT. I looked at SHOW ENGINE INNODB STATUS and it didn’t have anything interesting in it. There were no row or table locks, no UPDATE/INSERT/DELETE, or SELECT FOR UPDATE queries, and innodb_row_lock_waits was not incrementing. A colleague noted that there were a lot of entries in the MySQL error log, so I looked at that and found (amongst the clutter):
We were in an outage and the most important thing at this point was to resume selling shoes, dresses, and lingerie, so I collected as much data as I could for later review, dumped it into Evernote and killed the RUN_LONG_TIME query. Bam, the queries in “Waiting for table” state finished and the site came back online. Had that not solved the problem, another team member had his finger on the “fail over to the other server” button.
Outage over. Phew.
But, as my toddler likes to say — “What just happened?” The RUN_LONG_TIME query was expensive, but it shouldn’t have been blocking other queries from completing. First step, I went to a reporting server and tried to reproduce it:
All copasetic. What’s next, chief?
Time to look at some graphs. Because we have the complete output of SHOW GLOBAL STATUS logging to Graphite every few seconds, it is easy see what the server is doing at any given time. (You should do that, too. It’s incredibly valuable.) I started poking around at the charts on the active server and noticed a few oddities:
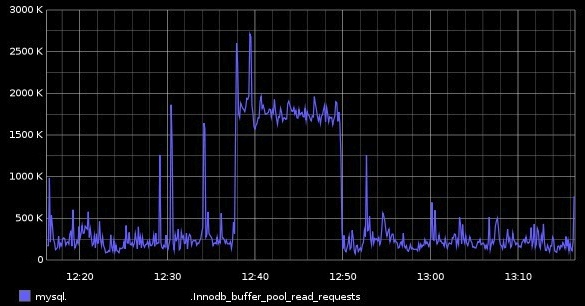
There was a lot of InnoDB buffer pool activity – several graphs looked like this:

That made sense, as the RUN_LONG_TIME query was sifting through a lot of data. A lot of data. A lot. 14 quadrillion rows, in my estimate.
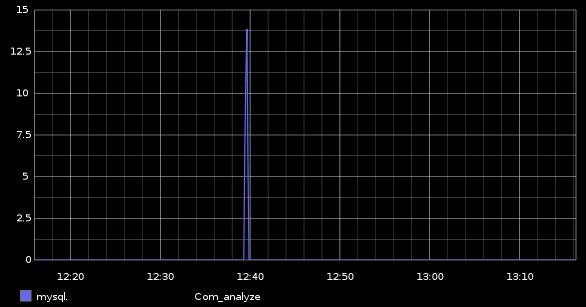
After seeing that pattern across a number of other stats, I started poking through the Com_* variables. Com_analyze looked like this:

What fool ran ANALYZE TABLE a bunch of times at peak traffic on the active database!? This is where I contracted a case of the RTFMs. As it turns out, ANALYZE TABLE statements are written to the binary log and thus replicated unless you supply the LOCAL key word (ANALYZE LOCAL TABLE).
I had not supplied that keyword.
As a result of my missing keyword, the ANALYZE TABLE statements replicated to the active server during peak traffic periods while a very long running query was in progress. Intuitively that still shouldn’t have caused this behavior. ANALYZE TABLE takes less than a second on each table. But that isn’t the whole story…
Back to the reporting server to attempt to reproduce the behavior:
The statement in session3 hung and was in “Waiting for table” status. Success (at failure)!
What happened is the ANALYZE TABLE flushed the table, which tells InnoDB to close all references before allowing access again. Because there was a query running while ANALYZE TABLE was executing, MySQL had to wait for the query to complete before allowing access from another thread. Because that query took so long, everything else hung out in “Waiting for table” state. The documentation on this point sort of explains the issue, though it is a little muddy:
The thread got a notification that the underlying structure for a table has changed and it needs to reopen the table to get the new structure. However, to reopen the table, it must wait until all other threads have closed the table in question.
This notification takes place if another thread has used FLUSH TABLES or one of the following statements on the table in question: FLUSH TABLES tbl_name, ALTER TABLE, RENAME TABLE, REPAIR TABLE, ANALYZE TABLE, or OPTIMIZE TABLE.
I explained the sequence of events and root cause to our team and also publicly flogged myself a bit. As it turns out, this issue only happened because of the combination of two different events happening simultaneously. The ANALYZE TABLE alone wouldn’t have been a big deal had there not also been a very long running query going at the same time.
I have a few take-aways from this:
- If you make a mistake, fess up. That’s a lot better than covering it up and having someone find out about it later. People understand mistakes.
- Mistakes are the best chances for learning. I can assure you, that I will never, ever forget that ANALYZE TABLE writes to the binary log.
- Measure everything that you can, always. Without the output of SHOW GLOBAL STATUS being constantly charted in Graphite, I would have been blind to any abnormalities.
- During an outage, resist the temptation to just “fix it” before grabbing data to analyze later. Pressure is on and getting things running is very high priority, but it is even worse if you fix the problem, don’t know why it occurred, and end up in the same situation again a week later.
- Try not to perform seemingly innocuous tasks on production servers at peak times.
- RTFM. Always. Edge cases abound in complex software.